It's a sad fact of life that it's too short, so we don't have time to learn everything that we need to know. For most biologists (and probably most scientists, and indeed social scientists), one of the things they should learn to do science well is statistics. Of course, the poor dears are too busy learning about things like biochemistry or PCR, to have time to learn about the important stuff.
Because of this, there is a lot they don't know, and also a lot of confusion about the bits they do know. I therefore thought it was worth writing a few posts about some of these issues, to try and dispel at least some of the confusion.
Now we're below the fold, I should admit that I don't mind too much the lack of knowledge - there are large swathes of statistics that I don't know about either (I was too busy admiring the paper aeroplane building skills of my fellow biochemistry students). The confusion is more of a concern, and I think it is largely because biologists get little training in statistics as undergraduates, so don't have the grounding in the theory when they start doing research. And, yes, I am generalising - some biologists do become very good statisticians. But there is still plenty of confusion.
A lot of basic confusion comes from not understanding the different parts of using models to analyse data. For the moment I am ignoring things like model checking, and how to interpret the results. This is not because they are unimportant, but just because I want to write a blog entry, not a monograph. Anyway, There are, I think, 4 parts that can be separated out:
Point 1 is often passed over, and points 3 and 4 are often confused with point 2. I will deal with the first two points in this post, and treat the others later.
To help disentangle the different parts, it is useful to have an example. For this, we can use a simple linear regression, such as the one I used here. The mathematical model is self-explanatory. For the regression, it can be written as
mi = a + b Xi
Yi ~ N(mi, s2).
The first line is the equation for a straight line. Xi is the covariate (year, in the example). This is then related to an expected value, mi. The second line says that each data point, Yi, is normally distributed with mean mi and variance s2.
Note that the data are assumed to be drawn from some distribution. Hence, they are random. However, they depend on parameters, in this case the mean and variance. Here the mean is modelled further, using an equation, so it is deterministic. i.e. if we knew the parameters, we would know the true value of the mean.
More complex analyses also have a model underneath them: the usual ANOVA actually has a model that is almost the same. The mean can be a function of several parameters, and might not be the mean, but just a parameter that controls the likelihood. The variance might also be modelled. And the parameters that are modelled could themselves be functions of more parameters. And all these parameters might themselves be random. Yes, things can get complex.
The problem, then, is to estimate the parameters. There are several schemes for doing this. For the model above, the two commonly used schemes are the frequentist and the Bayesian approaches. Each of these gives us a way to estimate the parameters. They are, in essence, philosophical approaches to understanding what we mean by probability and randomness. In the frequentist scheme, what we observe is random, with fixed parameters, and hence any statistic we calculate (such as the slope of the straight line) is a random function of the data. In contrast, the Bayesian approach is to say that anything we are uncertain about is random. Hence, we treat the data as fixed (because we know it: we have observed it), and the parameters are random.
Both of these philosophical schemes are useful in that they then can be used to construct methods for estimating the parameters of the mathematical model. Both use the likelihood, i.e. the probability of the data given values of the parameters, albeit in different ways. For example, the frequentist scheme tells us that we should find the values of the parameters which give us the maximum value of the likelihood. Hence, this is often spoken about as a maximum likelihood approach (there is another philosophical scheme which leads to the same equations, but to me it always looks like asking Fisher to wave his fiducial wand to make everything mysteriously right. I assume I'm missing something important).
Estimating the parameters is not enough, though. We also want to know how reliable they are. It makes a difference to our estimate that for every year J.K. Rowling writes an extra 300 pages if the range of possible values is 290-310 or 0-600. In the former case, we have a pretty good idea how much time to book off work to read her latest book: in the latter, we have little idea about whether we need to have a headache or major heart surgery. We can summarise the reliability in a variety of ways: a popular one is the probability that the estimate is less than zero. Alternatives include giving a range of likely values (typically a range for which there is a 95% probability that the estimate is within it), or a statistic such as a standard deviation to summarise the variability in the estimate (in the frequentist scheme, this standard deviation is called the standard error).
In my next post, I will describe the model fitting and model selection, i.e. how these schemes are used in practice to make inferences. I suspect this will include a rant about p-values.
Before I stop to work myself up into a frenzy, one last point is worth mentioning. The approaches discussed above assume that the data are normally distributed. If we discard this assumption, we can use different approaches. One, called least squares, is based on optimising a property of the model and data (i.e. minimising the sum of the squares of the differences between the data and the expected values). It turns out that this is the same as maximising the likelihood, i.e. it is mathematically the same as the frequentist approach. I, therfore, use the frequentist interpretation of the equations, and it gets round a lot of fiddly problems. Another, called non-parametric statistics, does away with any distributional assumption, but also throws away part of the data: rather than use the data themselves, the analysis concentrates on using the ranks of the data (i.e whether each Yi is the smallest, second smallest etc.). In some cases, I think this can still have a likelihood interpretation, but I must admit that I haven't checked: it's just a hunch.
Read more!
Monday, 30 July 2007
Statistical Modelling: The Bits Pt. 1

Still here?
Wow! The virtual world is still here!
I'm co-teaching a course with Bill Shipley in (sort-of) central Finland. Yesterday we drove up here, and settled in. I tried to get a wireless connection (I had been told there was one) from my room. My laptop would search and find a weak connection, and then when I tried to connect, it would disappear. Repeatedly. Once it decided to mock me by giving me two networks that I couldn't connect to. It would tell me that they were secure networks, which is a hint that I might need a password. But, being rational, I tried to connect anyway.
This may not be relevant at all, but I've just been reading a book about happiness, which explained that we often do things that we expect will make us happier, but we don't get the thrill at the end. This leads to addictive behaviour: we just can't stop ourselves even if we are objectively aware of the futility.
OK, must stop: I have to check my email.
Read more!
Saturday, 28 July 2007
The Academic Cult
Does anyone know who Bug Girl is? We have evidence that she needs to be reprogrammtrained.
It's all for her own good. Without retraining, she'll never be able to get another grant.
Read more!
Thursday, 26 July 2007
Reactions to the world's largest glider
A couple of weeks ago, a paper came out online in PNAS, describing the aerodynamics of Argentavis magnificens, a big bird (presumably it had yellow feathers too).
The serious report on this work was done a few weeks ago, but my, err, friend Henry Pihlström has been looking at the paper too closely.
Henry pointed out some details in Figure 4. Here is the figure:
And, for those who don't stare obsessively at journal figures (or at least not as obsessively as Henry evidently does), here is Fig. 4C in detail:
I think the man's reaction is understandable - you wouldn't see that coming towards you on Sesame Street.
Reference
Chatterjee S, Templin RJ, Campbell KE. (2007) The aerodynamics of Argentavis, the world's largest flying bird from the Miocene of Argentina. Proc. Natl. Acad. Sci. 104: 12398-12403.
Read more!
Wednesday, 25 July 2007
Squirrels are dangerous
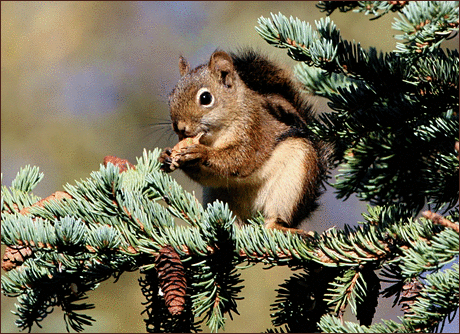
Brought on by this post, I thought I should explain about the dangers of Helsinki squirrels.
In most of Helsinki, one is safe from squirrels: you can happily walk through the station in the early hours, and you'll be fine. Places like Kallio and Hertaniemi: no problem. But be careful if you venture into Seurasaari. There you can walk through the forests along the paths. But if you take a wrong turn, you find them staring at you:
As you go further down the path, you will find yourself becoming more nervous - what is that scratching behind you? Does the path lead back to civilisation, or are you going deeper into the wilds? Is that duck in on the schemes?
Then you turn a corner and discover - some of them are armed
Fortunately, the importance of the tourist industry means that Helsinki City Council has the matter in hand. It is bad press to have your visitors mugged by a squirrel, and have their peanuts stolen. Therefore, they have organised special squads, who are trained to track down and kill down these monsters, even the biggest ones.
Read more!
Elephants, evolution, and hot testes
Sometimes the news on the BBC World Service brings up strange associations (and I don't mean the Conservative Party). Yesterday morning I heard a report about the latest findings on the evolution of elephants. The first thing that struck me was how good the report was: concise, informative, and went for accuracy rather than sensationalism. The other thing that struck me was that elephants don't have balls.
The BBC report was about a paper in PLOS biology, which reports firstly the first complete mitochondrial sequence of the extinct American mastodon. This sort of thing is now de rigour: extracting DNA from a tooth that is at least 50 000 years old, sequencing all the little bits, and then putting them back together to give an almost complete sequence. They then compare this sequence to sequences of other proboscideans, i.e. African and Asian elephants and a mammoth. From this they could work out the phylogenetic relationship between the species, and the dates when the different species diverged:
The shape of the tree is roughly what was expected. What was interesting what the timings of the divergences. A couple of technical points need to be raised to see why this is interesting. First, any phylogenetic tree gives the distance between different species, but it does not show where the tree started. This is because the processes of sequence evolution are indistinguishable whether we run them forwards or backwards in time. Hence, we can't find the start of the tree - the root. The usual solution to this is to include a species which is known to have been the first to diverge from the rest. This is called an outgroup: often is is selected on the basis of the fossil record.
Previous studies of elephants and their ilk have used the dugong or hyrax as an outgroup. This is a problem because these diverged from the proto-elephants at least 60 million years ago (Mya), but the elephants started diverging from each other less than 30 Mya. Hence, there is a lot of time in which the sequences could have diverged. This affects the dating of the divergences because (a) the molecular clock has had plenty of time to start running faster or slower, and (b) the differences between the sequences can start to saturate. The second point is important because the methods for estimating the times of divergence assume that the number of differences between sequences is proportional to time. When saturation occurs, this is no longer true. Hence, it would be better to use an outgroup that diverged more recently. The mastadon sequence provides this, as the fossil record can be used to date their divergence to about 25 Mya.
With this new outgroup, the divergences are pushed back in time, suggesting the mammoths and elephants diverges about 6 to 9 Mya. As the authors of the paper note, this is about the same time that humans, chimpanzees and gorillas diverged from each other. Now, this might be happenstance, but it could also be related to the changes in the environment at the time, as grassland spread throughout the world.
But, you are wondering, what about the balls? Well, the authors also found that the mutation rate is about half as fast in the elephants as in primates. The authors do not give a good explanation for this (they admit it themselves!). I don't have a good explanation either, but it did remind me of another paper, which was thrust into my hands whilst I was stood on the stairwell of the University of Helsinki museum. This paper pointed out that, according to the fossil record, elephants evolve really quickly, and hence could adapt to varying environments. They then pointed out that elephants don't have scrota: the testicles are kept near the kidneys, rather than migrating to somewhere cooler (this is called testicondy). It is well known that the mutation rate increases with temperature, and this has been used to explain why such a delicate piece of the anatomy hangs around outside the body. The suggestion, therefore, was that having the testicles inside the body increased the mutation rate, and hence induced more variation, so that there was more opportunity for selection to work: in other words, evolution could go faster.
How does this line up with the finding of a low mutation rate in the mitochondria? Well, one reason why mitochondria are studied is that they are only inherited from the mother. So, their evolution is obviously not affected by testicondy. Is it possible that the lower mutation rate in mitochondria offsets the higher rate in male nuclear DNA? It seems curious to me that there would be such a difference. But perhaps the elevated mutation rate in males is enough, so an increased mutation rate in females would increase the mutation rate above the optimum.
Hmmm.
References
Werdelin L., Nilsonne Å., Fortelius M. (1999) Testicondy and ecological opportunism predict the rapid evolution of elephants. Evolutionary Theory 12: 39-45.
Rohland N., Malaspinas A.S., Pollack J.L., Slatkin M., Matheus P., Hofreiter M. (2007) Proboscidean Mitogenomics: Chronology and Mode of Elephant Evolution Using Mastodon as Outgroup. PLoS Biol 5(8): e207 doi:10.1371/journal.pbio.0050207
Read more!

Tuesday, 24 July 2007
Book review: Bayesian Methods for Ecology
Review of Bayesian Methods for Ecology (NHBS) by Mick McCarthy I've been meaning to write this for a couple of weeks, but I've either been too busy, or the moment I sit down to write it, a cat appears and sits on the keyboard. Well, I sorted the cat problem: he leapt up, I cut his nails.
So, the title of the book is fairly explanatory: it's about Bayesian methods for ecology. It's clearly aimed at ecologists who are not trained in statistics, but who need to use statistical methods. Mick spends a lot of the first half of the book giving the background to Bayesian methods, justifying their use, and criticising the use of hypothesis testing. He then moves on to describing standard models (regression and ANOVA) and how to fit them in a Bayesian way. The final part of the book consists of case studies using Bayesian methods, showing how they work in practice.
On the whole, I really like the book: it provides a simple, easy to follow, explanation of what Bayesian methods are, and how to use BUGS to fit simple models. the latter point is important, as it means that ecologists can see how to use the methods in practice, and the code and data are available on the web.
One thing I did like about the book is its emphasis on using information from outside the data to improve the estimation. This is an aspect if Bayesian methods that I use less than I should, but is perhaps particularly important in practical conservation problems, where there is a lot of background information, and the aim is not to demonstrate some theory (where informative priors can bias the demonstration). If this book encourages scientists to use Bayesian method for problems where several strands of information have to be synthesised, then it will have done a useful service.
I have a couple of criticisms. The first is that I feel the strength of the Bayesian approach is in the way it can handle complex models. This relies on a hierarchical scheme for modelling data. Although this is mentioned, I would have liked to have seem more on it: I think a whole chapter would have been worth aiming for (and possible combining the regression and ANOVA chapters: they're really the same thing). My second criticism is over the excessive use of DIC. This is a criterion for comparing how adequately different models fit to the data. This is really a philosophical complaint: the problem with using criteria like DIC is similar to one problem with hypothesis testing: it says something about the statistical properties of the models, but nothing about the substansive, ecological, properties. Given enough data, DIC will show that the more complex model is better. It will not show whether the extra effects are important in any real way. I would rather see a greater emphasis on examining the parameters, and using them to decide if the more complex model explains anything: does removing the parameters reduce the predictive ability substansively (rather than statistically)?
So, the book isn't perfect, but I would still recommend it to ecologists wanting to understand the basics of Bayesian methods: not only does it give a glimpse of what they can do, but it also allows them to do it. I hope it will help ecologists (and others!) get over the first few steps to doing Bayesian analyses, by giving a simple explanation, and code to run (and change!) on simple problems. After that, what follows is the same, but bigger. Once the first hurdle is passed, more advanced problems can be tackled with the help of Andrew Gelman's latest book, so it should not be too difficult to progress to the complex models of the sort I find myself working on.
Read more!