Phew. Just finished the latest Harry Potter. And the trousers were a great help.
Yesterday I finished reading another book, Jealous Gods and Chosen People by David Leeming (it's on sale at the moment). For me, the two raised a couple of issues. So as not to spoil things, if you don't want to know what happens, don't read on...
Two things struck me. The first is something that's been bothering me about some strands of Christianity for some time, which David Leeming brings up and which is also a big theme in the Potter books. This is the idea of Love as an important force. The Christian message, for me, is that it is through Love, i.e. actually having concern and consideration for other people, that we are redeemed. This theme of the importance of love also plays a big part in the Harry Potter books, even if it is not always pushed down our throats (e.g. Narcissa). For me this is an important message, but one that is easily forgotten: it's why some of the fundamentalist Christian sects are so wrong. It's also why I get annoyed with atheists who attack anyone who believes in a God for being deluded and what have you: I have known several people (e.g. my ex-landlady in Norwich) who have been good, generous, loving Christians, and it has been their Christianity that has been the focus of this. Personally, I'm happy for people to believe in a God, if it helps them lead good lives.
Of course, some Christian groups will attack the Harry Potter series for promoting witchcraft (of course, because they already have). It's a shame, and rather ironic, that this means attacking a series of books that espouse and promote the philosophy of the person who's philosophy they claim to follow.
My other thought is more academic. Leeming talks about the Dying God myths, where a god or hero goes into the underworld to reappear later, signifying some sort of rebirth such as of the seasons, or of a spiritual redemption. This is a theme in several myths, not just in the Middle East, and the tales tell of these heroes descending to strange places, possibly crossing seas and rivers to get there, and gaining wisdom whilst amongst the dead, and letting their bread go mouldy. Harry Potter does this too. But why does his underworld have to be Kings Cross Station?
Read more!
Saturday, 21 July 2007
Harry Potter and the Dying God

Harry Potter and the Change of Trousers
It's been warm this week, so I've been wearing shorts. Today, however, I'm back in long trousers, even though it's no cooler. Why?
Well, because of this:
Yes, I have the new Harry Potter, and I'm not afraid to read it.
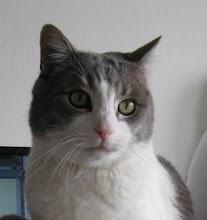
But what I am afraid of is the beast. For his claws are sharp, and if I'm going to be laying on the sofa all day, he's going to want to sit on me. With shorts, I have no protection from when he catches things in his dreams. Hence the long trousers.
I sense a long (607 page) day ahead, with brief breaks for food, toilet and turning on Test Match Special. No doubt Kevin Pietersen will be praying for rain, so he can sit in the corner all day reading.
Read more!
Wednesday, 18 July 2007
African or European?
Sometimes I feel obliged to make the obvious joke, just so that nobody else has to embarrass themselves. So it is with this paper.
I'll look at it properly later, but for the moment it suffices to say that they look at the flight speed of different birds, and try to explain that by allometry (shape) and other things. The important point is that they miss of one species: the fully-laden swallow.
Shame on them!
Reference: Alerstam T, Rosén M, Bäckman J, Ericson PGP, Hellgren O (2007). Flight Speeds among Bird Species: Allometric and Phylogenetic Effects PLoS Biology 5(8), e197 doi:10.1371/journal.pbio.0050197
Read more!
Tuesday, 17 July 2007
On the growth of literary yeast genes
I think one reason I enjoy working as a statistician so much is that we can use the tools of my trade to tease out patterns in data, and actually learn something about the world we live in. One aspect of this is the realisation that if one is trained in statistics, then one is aware of how much more can be extracted from the data. Oh, and also spot subtle mistakes. So, whilst I feel statistics is a service industry: there to help others in their work, there is also a strong element of either pride or egotism in my work. In the light of this...
A couple of computer scientists have just had a paper released in PNAS on "Temporal patterns of genes in scientific publications" (all figures below are from the paper). They looked at how references to genes changed over time in the scientific literature, in particular yeast genes, and whether there was variation in the way different genes were treated. I suspect this was done because it looked like a fun thing to do (a motivation I thoroughly approve of), but it does have implications for the way science is done. We might expect that some "super genes" are intrinsically more important, and hence there is more work on them than on others. Or the patterns of investigation might just be a result of following the herd: people study genes just because others are studying them. Now, a paper like this can't give a full explanation for the patterns of investigations, but it can give some useful information: it can show what the patterns are, and so help focus a more detailed investigation on the interesting aspects of what's going on.
What they did was to get their computers to trawl through the scientific literature and find all the mentions of thousands of yeast genes between 1975 and 2005. Having done that, they then asked how the pattern of references to these genes evolved. The data for two genes look like this:
ACT1 is the most popular gene, whereas PET54 is more typical. The solid lines give the actual data, the dotted line is from a simulation. They assumed a simple model where the number of references to a gene depended on three things:
So, they're imagining a system where work on a gene starts occurs randomly (this is the background rate), but the more work there is on yeast genes, the more likely work on a new gene will start. Makes sense: for whatever reason, someone gets a grant and starts to work on a gene. And this can be seeded by work on another related gene that is part of the same biochemical system. Once work on a gene is started, it should beget more work on that gene; it's good scientific practice, every answer brings up 3 more questions (and hence three more grant applications).
This model wasn't quite good enough though, so they added a saturation term: looking at the data, eventually the rate of citations slows down (for those who are interested, they use the Maynard-Smith and Slatkin model of density dependence). They then fitted this model to the data, assuming the same parameters for all genes (*). At about this point I think "whooo, dodgy". Determined to thwart me in proving my superiority, they then show that this model predicts the distribution of references pretty well. They suggest that what this is showing is that the assumption that the parameters are the same is reasonable. In other words, the genes are behaving equivalently, and there aren't any genes that are more important (and hence more highly cited) than others.
What this implies is that there is nothing intrinsically more important about any one gene as compared to any others: they are behaving as if they are equal, and the reason any one gene is researched more is just happenstance. Once genes become popular, they get researched on more. I guess this could be explained simply because there are more questions that can be asked about a better studied gene.
A few things bother me about this research, though. First, the interpretation of the parameters is off. The authors claim that, if there is no saturation, the growth rate of citations is 0.23, the sum of the growth rates for the gene effect and the general rate of gene reference. Well, um, OK. Let's look at the equation (ignoring saturation, for simplicity):
Ni,t = 0.028 P*t-1 + 0.20 Pi,t-1 + 0.005
Nt is the number of new references about a gene in a year, P*t-1 is the total number of references about all genes (including gene i) up to year t-1, and Pi,t-1 is the total number of references about gene i up to year t-1. So, the growth rate is only 0.23 (=0.028+0.20) if the number of citations for any one gene (Pi,t-1) equals the total number of citations of all genes (P*t-1) (and so the total number of genes is... work it out for yourself). There are over 4000 genes in the data base, so the strength of effect of the total genes should be much higher: on
average, the effect of P*t-1 shoud dominate.
They compound this error by claiming that most of the growth is caused by the gene itself. The model above says that an increase in one reference to one gene in one year leads to an average of 0.2 references in the next year, whereas an increase in one reference to a yeast gene in general leads to 0.028 references (on average) the next year. Look like the effect of a single gene is stronger, doesn't it?
No. There are 4000 genes, so there is more variation in the total number of references of genes. If we only had 100 genes, all equally cited, then if they all increased by 1 reference in a year, then Pi,t-1 would increase by 1, leading to an increase in reference due to this of 0.2, but P*t-1 would increase by 100, so causing an increase of 0.028*100 = 2.8. i.e. over 10 times higher.
Statistically, the point is that the interpretation of regression coefficients depends on the variation in the covariate: one can get larger coefficients simply by changing the measurements from kilometres to nanometres. Substansively, the point is that the dynamics are probably not being driven by single genes, but by the overall rate of growth in yeast genetics. This could be because yeast genetics overall is experiencing growth, or because there has been an inflation in papers generally in science. But it suggests that the dynamics are even more neutral: work on a gene does not beget more work on that same gene. But, I am not convinced that we can conclude this, because...
My other concern is that it's not at all clear to me that the model is working well. One problem is that the model seems to predict too few intermediate genes. This is their plot:
The dots are the observed frequency, the crosses are the simulated frequency. In the middle of the plot, the dots are all above the crosses, so too few genes are being predicted with intermediate frequencies. I'm not sure what this means: usually one would expect the opposite pattern, as variation in the parameters make some genes more extreme. My initial guess is that the rate at which genes appear is not homogeneous: if genes appear at a greater rate in the middle of the time period studied, then this is what we would see. The simulation would spread these genes out over the whole time period, so there would be more genes appearing early (so having more citations) and late (so having very few citations).
Unfortunately, I'm guessing about this, which bring me on to one of my big Statistician Are Important points. The way the model is checked is very simple, so it could be missing a lot of problems. My main worry is that the data were collected at the gene level, so I would like to see how the model predicts the behaviour of individual genes. In the first plot above we see a couple plotted, and it looks like the prediction for ACT1 is poor: it badly under-predicts the behaviour from about 1995. However, this is only one simulation: what about the rest? If they all do this, then there is a problem with predicting the popular genes, i.e. the ones that yeast biologist have decided are important.
There is a lot of data, but something as simple as plotting the residuals (the difference between the observed values and those predicted by the data) against the predicted values is often very telling. For example, if the model fit plot above was plotted as a residual plot, it would give a curve that would be frowning at us, whereas a good residual plot shouldn't have any visible pattern. This could simply be done for all the data (giving one huge plot!), or for subsets (e.g. sub-setted by popularity). I suspect all sorts of problems would be seen: some important, others trivial and ignorable.
So, OK. I'm not a great fan of the analysis. What would I do? I think the first thing would be to look at the data. There is too much to look at it all, but it might be possible to cluster the genes into groups according to their publication record, and look at representatives from each group. From that, I could get a feel for how they are behaving: are most increasing exponentially? Do many reach a plateau? Do they decrease in publication (as researchers get bored and move on to other genes)? Do different genes become popular at different times? Or do all the plots look similar? This would guide me in deciding what sort of model to fit.
Then I would look at fitting a model with different parameters for each gene. I might drop rare genes first: the ones that only get mentioned once or twice. Any estimates for them will be crap anyway. Now, this leads to a lot of parameters, but we can use an approach called hierarchical modeling: basically, assume that the parameters are related, so knowing about 20 parameter values tells us about the 21st. This gives us a direct way of measuring how similarly the genes are behaving: if the parameter estimates are almost the same, then the genes are acting the same. We can even ask where the differences are: is it that genes are appearing in the literature at different times? Or are the growth rates different - i.e. do some genes spawn 10 publications per publication whilst other only spawn 1 or 2?
Once this has been done, we can then check if the model actually works, i.e. if it actually predicts the data well. If it doesn't, then we have to do the process again, based on what we have learned. This can be something of an iterative process, but eventually it should converge to a reasonable model. Hopefully.
The advantage of the approach I'd envisioning is that it becomes more of a conversation with the data (or an interrogation, if it doesn't want to behave). The process is one of learning what the data is telling us, using the plots and models to pick out the important information. We then need to interpret this information (correctly!) to be able to say something about the system - i.e. whether the genes are behaving the same, or what are the differences in rates of reference. And also the extent to which work on one gene is driven by previous work on the same gene, or whether yeast genetics is working by looking at genes in general. One could even try to ask questions about whether this has changed in time: has there been a shift from focus on a single gene to a more general, holistic approach (i.e. do the regression parameters in the equation above change over time. More hierarchical models)? These are all questions that could be tackled: the techniques are there, as long as the data is prepared to cooperate.
Stepping back a bit, and trying not to trip over the cat, this shows a response I have to many papers. The questions are interesting, but the data analysis and interpretation can be improved. For this paper, the problems in the analysis are fairly typical: I suspect the authors are not aware of the techniques that are available. This is understandable, as statistics is its own field, and I would be as lost in, say, yeast genetics. It's because of this that statisticians are needed: even if it's just to have a chat to over coffee, or a pint of Guinness. The interpretation aspect is more of a problem for me: it does not need a great technical knowledge to understand what is wrong, just an appreciation of what the equations mean.
Overall, could do better. But I hope I've shown how to do better. Constructive criticism, and all that.
Reference: Pfeiffer, T. & Hoffmann, R. (2007) Temporal patterns of genes in scientific publications. Proc. Natl. Acad. Sci., 104: 12052-12056. DOI: 10.1073/pnas.0701315104.
* Technical note: they used a general optimisation algorithm (optim in R) to do this. However, given the values of alpha and PS, the model is a generalised linear model with an identity link. So, they could have used used this fact, and just written a function that would optimise alpha and PS, fitting the model as part of the function. Actually, I think I would have started with a density dependence function with one less parameter: even easier!
Read more!
Saturday, 14 July 2007
Asturias Report
Right, folks. Finally, having finished my week-long battle with a manuscript, I can finally report on my trip to Asturias. I should start by thanking Alfredo, Cano and David for their hospitality: the food and drink was excellent, as was the conversation. Especially the tail of the vegetarian dog (short version: owner claims dog is vegetarian. Dog disproves this, using neighbour's rabbit).
Read more!
My purpose was to try and teach Bayesian inference to the biologists there. I don't want to report on that, other than to point out my new variant on the Monty Hall problem:
In my variant, you don't want to win the car. Actually, you're not too keen on winning the bull either. In fact, it looks like loosing is a decent option.
The only other things worth pointing out about the actual course are the exhibit downstairs: (which is just an excuse to link to a well known science blog). The other point is the view from the window of the room I was teaching in:
 Yes, hills! Scenery! I suspect I'd really enjoy the weather in Asturias: I can enjoy the rainy, overcast weather when it looks really dramatic. I think it's something about being English. And we did have quite a bit of sun, although overall the weather was changeable (and only foggy on Saturday).
As to Asturias itself, I was teaching in Oviedo, which is the capital of Asturias. It has historical bits, it has modern bits, it has everything you expect from a town. It also has strange statues - most of which would shock the sensitive. Hence, no photos.
The kingdom of Asturias was founded by King Pelayo in the 8th century. To do this he had to beat off the Moors, who were intent on taking over the whole of Spain and installing wallpaper patterns in their palaces. Pelayo found an effective strategy to combat them: one used by the Scottish previously against the Romans. His simply made sure that the weather was awful enough that the Moors wouldn't want to invade. Hence he is honoured in Gijon with a statue of him, looking out to sea with an early anenometer: The Asturians also honour him in their drinking traditions. They pour their cider from a great height, enabling them to judge the wind speed and direction (and its strength, when they drink it, tells them how hard it's raining):
 This, incidentally is a real cider: for those who haven't tasted it, it's like a good English scrumpy. Which means it taste nothing like a commercial cider. This stuff has had apples in it!
On the Wednesday, Cano took me to Gijon for the afternoon. Gijon is his home town, and it more working class (read: could do with some paint in places). But it is on the coast, and ahs a nice beach, and some decent touristy bits. This is Cano: and these are his feet:
 Cano had to go for a swim in the Atlantic: I think he was forgetting what waves are like, as Finland doesn't have waves, only wakes. After Cano had had enough of waving his feet at us, we went for a walk around the town, and came across this curious sight:
 Apparently when they were building the quay, the townsfolk got up one morning after a spring tide and found that an English captain had berthed his ship on top of the building site. Rather than remove the ship, they decided to build the rest of the quay over the top, and just fill in with concrete. The captain went down with his ship.
After that story, there was only one thing to do: go for a drink. So we retired to a bar and had some cider: North by north-west, force 6.
Wednesday, 11 July 2007
This is what I should look like
I had been intending to post some photos from my Asturias tip, and a couple of other things. But I've been fighting a manuscript all week. In the mean time, as everyone else has been doing it, here is my Simpsons avatar: Apart from the problem cause by a shortage of beards, I think it wasn't too bad.
Get yours from the Simpsons' movie page.
Read more!
Sunday, 8 July 2007
The Travails of Travel
Phew, I finally got back from Spain. Air travel horror stories are hardly rare, and I'm sure this one deserves the response "so, what's all the fuss about?". To which I can only reply "but it's my story".
The plan was to take a taxi from the hotel in Oveido to Asturias airport, and make sure they give me a factura (sorry, not much use if you don't speak Spanish). This bit went off fine, I have the receipt and during the trip I was afforded magnificent views of the Asturian landscape, with the low-hanging cloud, and mist (I'm not being sarcastic - I actually like the scenery like this).
My original flight plan was Oveido - Barcelona - Frankfurt - Helsinki. When I got to the airport, I was told that the flight to Barcelona was delayed by two hours, because of the fog, so I was switched to a flight to Madrid, and after that to Frankfurt then the same flight to Helsinki. Great I thought (and sometimes I am sarcastic). I hate Madrid airport - after sitting around in it for a couple of hours, you realise that there is a real difference between bland and soullessness. Anyway, I checked myself and my luggage in and waited to be told we could go through the security gate. But then... the flight was cancelled. The plane from Madrid had been diverted to an alternative destination - Madrid. Poor passengers.
So, I had to get a new flight. The Spannair ladies were doing a magnificent job - once the cancellation was announced, I went to their desk (again), and found that they were already finding me a new route. They sorted that out, got my luggage back, and explained to the Iberia check-in staff what was going on. My new route was (and get your maps out for this, folks) Asturias - Paris (Orly) - Nice - Helsinki, getting into Helsinki at about midnight. Well, OK. If that's what it takes.
The good news is that this time the flight took off (despite the observation at check-in that they would tell us the gate later - if they could get us a plane), and got to Orly with no problems. I managed to get checked in and onto the flight to Nice with not much more than the occasional piece of Parisian impoliteness. I had been given a window seat, so I had the opportunity to watch the ground crew doing their stuff preparing the plane: refuelling, loading the luggage, and driving away from the plane. With my bag.
It's difficult to know how to respond to this. Leaping out of my seat shouting "Come back with my bag!" would hardly be effective. The British thing to do would be to ring the bell for the flight attendant to ask them if they could possibly tell the ground crew, that the bag they were driving away should be on the plane. And could they, if it wasn't too much trouble, bring it back and put it in the hold. But it was obvious that this wouldn't have any effect - I'm sure it would have taken too long to sort out, and instead nothing would be done - and this is probably the right reaction, otherwise the plane would have been horribly delayed. So, instead I did the other British thing - once we were in the air, I ordered a beer.
nice airport is quite Nice, even if I couldn't find any biscuits for sale. I managed to get checked in (again), and the lady was very sympathetic about my worries over my bag. Waiting for this last flight took me back into the Finnish sphere of influence - I guess I've been here long enough, so it's comforting to hear Finnish spoken, even if I don't have a clue what they're saying. This was a Blue 1 flight, which means you have to buy your own food and drink. Obviously, the prices are sky high (Laugh at that. Please) but equally obviously there are great profits to be made from keeping 200 Finns stuck in a metal box for 3 hours and selling them alcohol. Looking back, it is clear that there are some aspects of Finnish character that I have absorbed.
We touched down in Helsinki on time (i.e. midnight), and I had the odd experience of waiting for my luggage that I knew wasn't going to turn up. I think I had to do this - if I had just gone to report it missing, I'm sure I would have been asked how I could be so sure. Once my had luggage failed to turn up, I went to the desk to complain about this. The lady was very helpful, and discovered that it had been kept in Orly, and that apparently they didn't know what to do with it (it seems that it's not possible for luggage to travel from Paris, Orly to Paris, Charles de Gaulle), so they sent it to Nice. I wonder what the Nice people will think of this - the next direct flight is on Monday. So either they have to sort out its re-routing, or my baggage will be waiting for an extra day on the Cote d'Azur. I hope it doesn't get sun-burnt sitting on the beach all day.
All of this is a long-winded way of explaining why I haven't put up a load of photos of Oviedo and Gigon. Because you can guess where my camera is. Well, actually I'm not even sure you'll be able to do that.
Read more!